Python for AI
Github: https://github.com/xfactor-toml/road-to-ai/tree/master/python
1. Install Python Environment
- Download anaconda latest release and install.
- Run
Anaconda Promptfrom start menu. - Run
conda install pydotpluson Anaconda Prompt.
PyDotPlus is an improved version of the old pydot project that provides a Python Interface to Graphviz's Dot language.
- Run
pip install tensorflowon Anaconda Prompt.
2. Why use Jupyter notebooks for machine learning?
Jupyter Notebooks are a browser-based, open-source tool that can be used for AI and machine learning research, modeling, and experimentation. They provide an interactive environment that allows users to run code step-by-step, see results immediately, and share their work with others.
3. Python Basics
3.1 List
x = [1, 2, 3, 4, 5, 6]

print(len(x))
print(x[:3])
print(x[-2:])

x.extend([7, 8])
print(x)

x.append(9)
print(x)

y = [10, 11, 12]

listOfLists = [x, y]

print(listOfLists)
Result:
6
[1, 2, 3]
[5, 6]
[1, 2, 3, 4, 5, 6, 7, 8, 7, 8]
[1, 2, 3, 4, 5, 6, 7, 8, 7, 8, 9, 9]
[[1, 2, 3, 4, 5, 6, 7, 8, 7, 8, 9, 9], [10, 11, 12]]
3.2 Tuple
x = (1, 2, 3)
print(len(x))

y = (4, 5, 6)
print(y[2])

listOfTuples = [x, y]
print(listOfTuples)

(age, income) = "32,120000".split(',')
print(age)
print(income)
Result:
3
6
[(1, 2, 3), (4, 5, 6)]
32
120000
3.3 Dictionaries
# Like a map or hash table in other languages
captains = {}
captains["Enterprise"] = "Kirk"
captains["Enterprise D"] = "Picard"
captains["Deep Space Nine"] = "Sisko"
captains["Voyager"] = "Janeway"

print(captains["Voyager"])

print(captains.get("Enterprise"))

print(captains.get("NX-01"))

# Iterate the keys
for ship in captains:
    print(ship + ": " + captains[ship])
Result:
Janeway
Kirk
None

Enterprise: Kirk
Enterprise D: Picard
Deep Space Nine: Sisko
Voyager: Janeway
3.4 Functions
def SquareIt(x):
    return x * x

print(SquareIt(2))

#You can pass functions around as parameters
def DoSomething(f, x):
    return f(x)

print(DoSomething(SquareIt, 3))

#Lambda functions let you inline simple functions
print(DoSomething(lambda x: x * x * x, 3))
Result:
4
9
27
3.5 Looping
for x in range(10):
    if (x == 1):
        continue
    if (x > 5):
        break
    print(x)

x = 0
while (x < 5):
    print(x)
    x += 1
Result:
0
2
3
4
5

0
1
2
3
4
4. Pandas
Pandas is a Python library that makes handling tabular data easier.
4.1 Pandas Basic
import pandas as pd

df = pd.read_csv("../assets/PastHires.csv")
df.head(5)
df.tail(4)
Result:
| Years Experience | Employed? | Previous employers | Level of Education | Top-tier school | Interned | Hired | |
|---|---|---|---|---|---|---|---|
| 0 | 10 | Y | 4 | BS | N | N | Y |
| 1 | 0 | N | 0 | BS | Y | Y | Y |
| 2 | 7 | N | 6 | BS | N | N | N |
| 3 | 2 | Y | 1 | MS | Y | N | Y |
| 4 | 20 | N | 2 | PhD | Y | N | N |
| Years Experience | Employed? | Previous employers | Level of Education | Top-tier school | Interned | Hired | |
|---|---|---|---|---|---|---|---|
| 9 | 0 | N | 0 | BS | N | N | N |
| 10 | 1 | N | 1 | PhD | Y | N | N |
| 11 | 4 | Y | 1 | BS | N | Y | Y |
| 12 | 0 | N | 0 | PhD | Y | N | Y |
4.2 Pandas Attributes
df.shape
df.size
len(df)
df.columns
Result:
(13, 7)
91
13
Index(['Years Experience', 'Employed?', 'Previous employers',
       'Level of Education', 'Top-tier school', 'Interned', 'Hired'],
      dtype='object')
4.3 Pandas Selection
df['Hired'][:5]
Result:
0    Y
1    Y
2    N
3    Y
4    N
Name: Hired, dtype: object
df[['Years Experience', 'Hired']]
Result:
| Years Experience | Hired | |
|---|---|---|
| 0 | 10 | Y |
| 1 | 0 | Y |
| 2 | 7 | N |
| 3 | 2 | Y |
| 4 | 20 | N |
| 5 | 0 | Y |
| 6 | 5 | Y |
| 7 | 3 | Y |
| 8 | 15 | Y |
| 9 | 0 | N |
| 10 | 1 | N |
| 11 | 4 | Y |
| 12 | 0 | Y |
4.4 Pandas Manipulation
df.sort_values(['Years Experience'])
Result:
| Years Experience | Employed? | Previous employers | Level of Education | Top-tier school | Interned | Hired | |
|---|---|---|---|---|---|---|---|
| 1 | 0 | N | 0 | BS | Y | Y | Y |
| 5 | 0 | N | 0 | PhD | Y | Y | Y |
| 9 | 0 | N | 0 | BS | N | N | N |
| 12 | 0 | N | 0 | PhD | Y | N | Y |
| 10 | 1 | N | 1 | PhD | Y | N | N |
| 3 | 2 | Y | 1 | MS | Y | N | Y |
| 7 | 3 | N | 1 | BS | N | Y | Y |
| 11 | 4 | Y | 1 | BS | N | Y | Y |
| 6 | 5 | Y | 2 | MS | N | Y | Y |
| 2 | 7 | N | 6 | BS | N | N | N |
| 0 | 10 | Y | 4 | BS | N | N | Y |
| 8 | 15 | Y | 5 | BS | N | N | Y |
| 4 | 20 | N | 2 | PhD | Y | N | N |
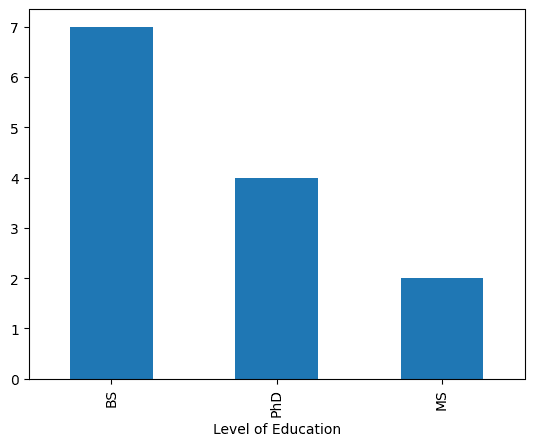
degree_counts = df['Level of Education'].value_counts()
degree_counts
Result:
Level of Education
BS     7
PhD    4
MS     2
Name: count, dtype: int64
degree_counts.plot(kind='bar')
Result: